We’ve researched average rents and earnings across the UK, to bring you Rent Freedom Day: the day of the year when you earn enough to pay off your annual rent.
What is Rent Freedom Day?
Until Rent Freedom Day, all the money the average renter earns is going towards their rent for the year.
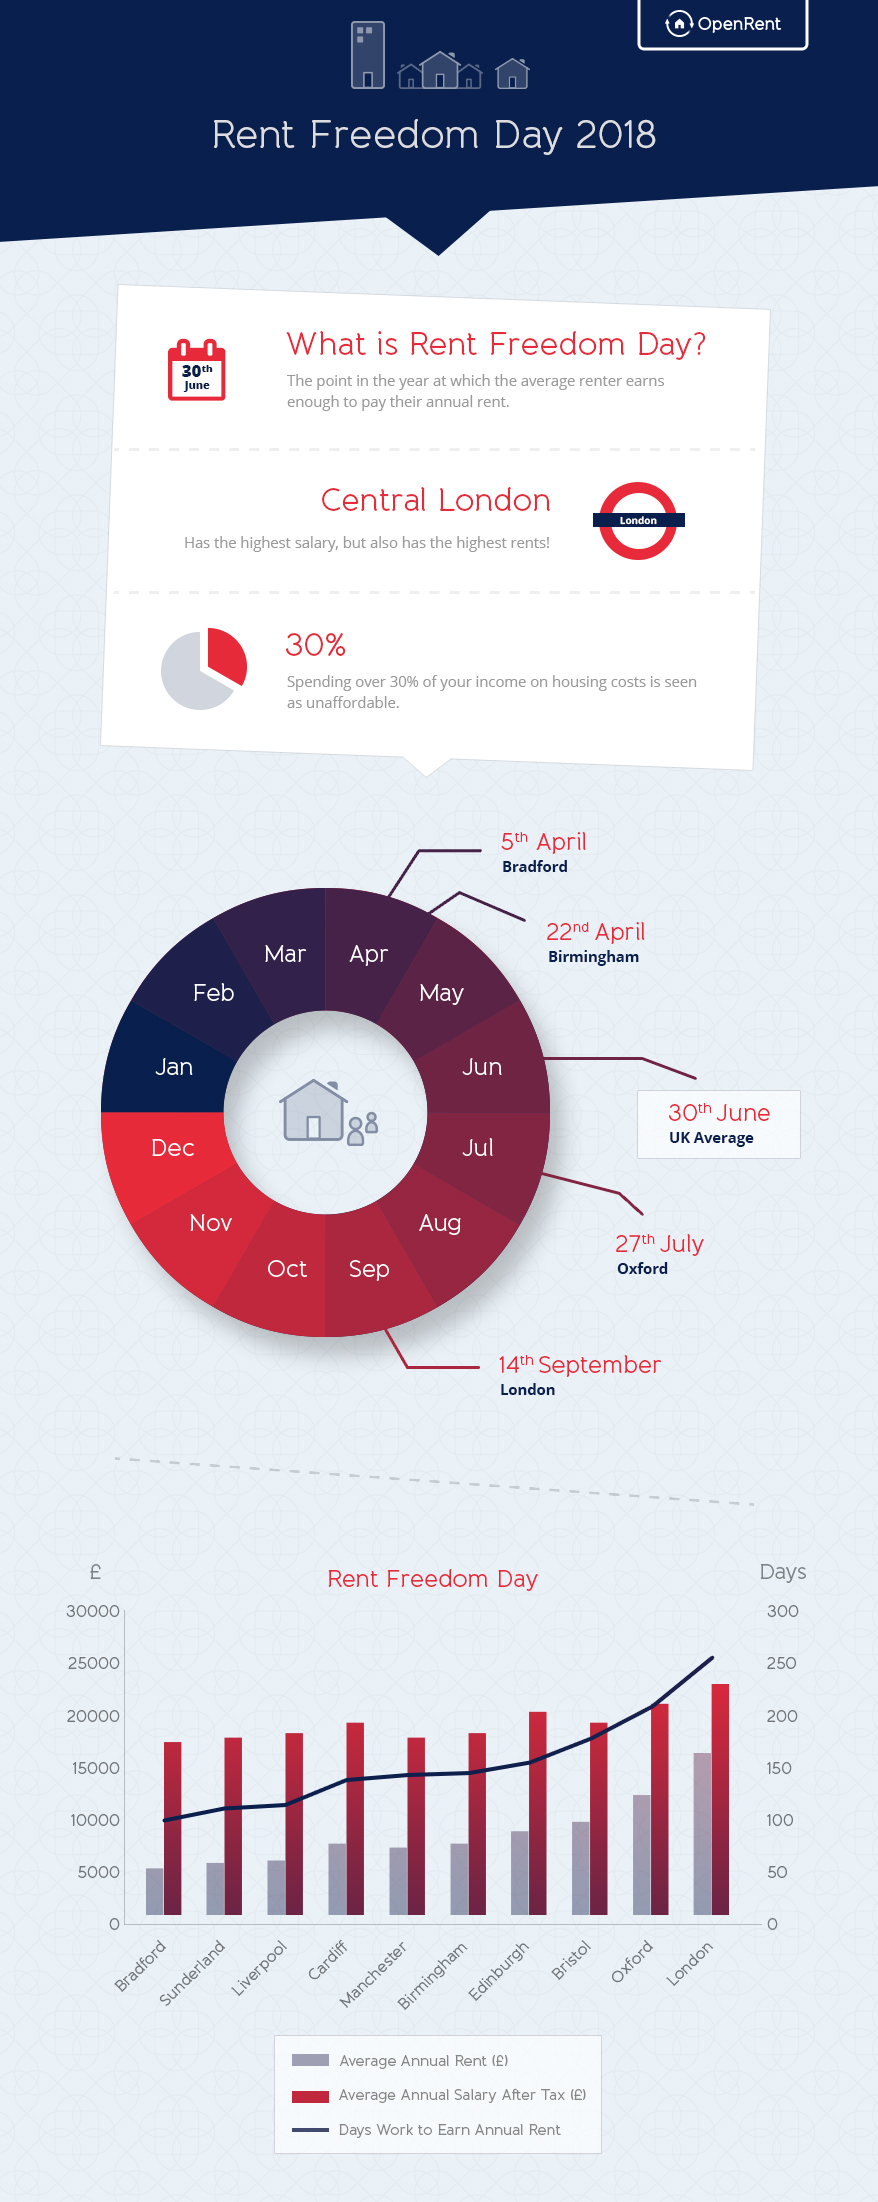
Rent Freedom Day is the day on which the average renter earns enough money to pay their annual rent, assuming one person renting a one-bed property. It is an indication of the affordability of renting in a given area.
UK & Regional Rent Freedom Day Dates
UK: 30th June
London: 14th September
UK (excl. London) 21st April
The results are pretty depressing. A UK tenant earning the average income and paying the average rent for a one-bed property has to wait until 30th June to earn enough take-home pay to cover their rent.
That means 50% of the average renter’s take-home pay goes to rent, unless they decide to move in with their partner, or share a property with other households.
It is Londoners who have longest to wait before earning their annual rent, taking until the 14th September to overcome their rental costs. If we exclude London, then Rent Freedom Day for the rest of the UK comes right down to 21st April.
North/South Divide
Elsewhere, Southern English cities performed worse than their Northern counterparts, with Southampton, Bristol and Oxford all in the bottom five.
In Scotland, tenants in Edinburgh have to wait until 1st June to be free from rental costs. Renters in Cardiff have it slightly better, seeing Rent Freedom Day on 16th May.
Rural areas and cities in the North have the most affordable rent. Renters in rural areas like Northumberland, Shropshire and Lincolnshire earn their annual rent by mid-April. Meanwhile, the most affordable place to rent is Bradford, where Rent Freedom Day is 5th April.

| Ranking | Location | Rent Freedom Day | Average Monthly Rent (£) | Average Annual Post-Tax Income (£) |
| 1 | Bradford | 05-Apr | 375.05 | 17,233 |
| 2 | Northumberland | 06-Apr | 389.29 | 17,848 |
| 3 | Lincolnshire | 11-Apr | 393.33 | 17,065 |
| 4 | Sunderland | 17-Apr | 430.99 | 17,600 |
| 5 | Shropshire & Mid Wales | 19-Apr | 439.59 | 17,599 |
| 6 | Liverpool | 20-Apr | 455.31 | 18,078 |
| 7 | Newcastle | 29-Apr | 477.67 | 17,618 |
| 8 | Leeds | 02-May | 530.36 | 19,079 |
| 9 | Sheffield | 02-May | 500.53 | 17,986 |
| 10 | Devon | 03-May | 475.40 | 16,918 |
| 11 | Norfolk | 07-May | 499.76 | 17,282 |
| 12 | Leicester | 15-May | 503.66 | 16,338 |
| 13 | Cardiff | 16-May | 592.41 | 19,146 |
| 14 | Nottingham | 20-May | 515.66 | 16,154 |
| 15 | Manchester | 20-May | 560.11 | 17,505 |
| 16 | Birmingham | 22-May | 591.71 | 18,198 |
| 17 | Glasgow | 26-May | 610.87 | 18,286 |
| 18 | Southampton | 01-Jun | 639.55 | 18,403 |
| 19 | Edinburgh | 01-Jun | 702.56 | 20,199 |
| 20 | Bristol | 25-Jun | 772.09 | 19,231 |
| 21 | Oxford | 27-Jul | 994.97 | 20,988 |
| 22 | Central London | 10-Sep | 1413.52 | 24,496 |
| 23 | London | 14-Sep | 1348.94 | 23,028 |
Notes on the Data
This data uses the average personal income by area as supplied by the ONS. After-tax salary is approximate and assumes no student loans and age<69. Daily income is per calendar day of the year, not working/week day. Take-home pay after tax is calculated by the Salary Calculator.
It uses OpenRent’s average rental data for one-bed properties (excluding studios and rooms in shared accommodation).
It should be noted that renters are much more likely to be in the bottom two income quintiles than mortgagers or owner occupiers. Therefore, the ‘real’ Rent Freedom Day could be later than these results show.
Start the discussion at community.openrent.co.uk