Bad news for London renters, who find themselves at the bottom of yet another quality of life table!
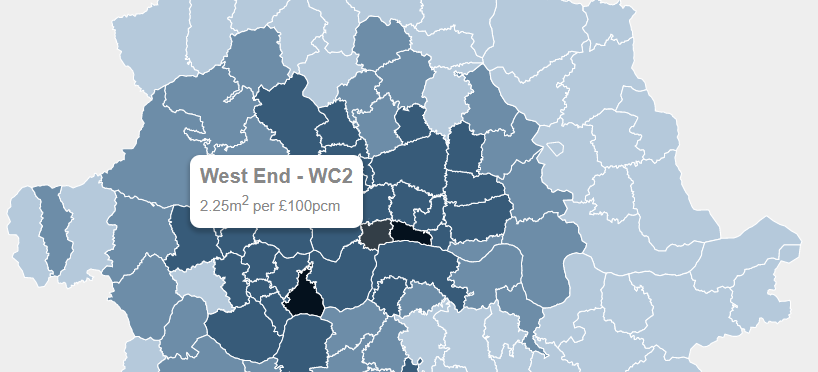
Using our data as UK’s largest letting agent, we revealed how much floor area £100pcm can rent you across England & Wales.
Looking at urban and rural locations, we’ve used data from tens of thousands of properties to calculate which areas of the UK offer renters the most living space.
UK Rental Data on Average Floor Area per £100 Rent
| One Bed Properties | |||
| City | Average Floor Area (m) | Average Rental Amount (£ per calendar month) | Floor Area per £100 |
| Lincolnshire (Rural) | 94.50 | 487.50 | 19.38 |
| Shropshire & Mid Wales (Rural) | 76.95 | 442.42 | 17.39 |
| Bradford | 52.69 | 384.00 | 13.72 |
| Northumberland (Rural) | 46.92 | 344.17 | 13.63 |
| Sunderland | 56.88 | 428.05 | 13.29 |
| All Rural | 62.05 | 467.58 | 13.27 |
| Devon (Rural) | 60.01 | 497.50 | 12.06 |
| Liverpool | 53.04 | 447.11 | 11.86 |
| Sheffield | 51.80 | 485.18 | 10.68 |
| Leicester | 51.18 | 488.18 | 10.48 |
| Leeds | 55.68 | 538.18 | 10.35 |
| Newcastle | 51.63 | 509.64 | 10.13 |
| Nottingham | 48.57 | 498.67 | 9.74 |
| Norfolk (Rural) | 46.53 | 502.22 | 9.26 |
| Birmingham | 49.39 | 542.18 | 9.11 |
| Manchester | 47.57 | 530.54 | 8.97 |
| Cardiff | 49.48 | 625.00 | 7.92 |
| Oxford | 72.93 | 939.39 | 7.76 |
| Bristol | 58.68 | 802.19 | 7.31 |
| Southampton | 47.39 | 651.40 | 7.28 |
| Portsmouth | 45.41 | 629.39 | 7.21 |
| London | 50.56 | 1320.81 | 3.83 |
| Central London | 50.48 | 1389.60 | 3.63 |
–
| Two Bed Properties | |||
| City | Average Floor Area (m) | Average Rental Amount (£ per Calendar Month) | Floor Area per £100 |
| Northumberland (Rural) | 68.39 | 436.25 | 15.68 |
| Shropshire & Mid Wales (Rural) | 102.09 | 652.18 | 15.65 |
| Bradford | 66.20 | 446.47 | 14.83 |
| Lincolnshire (Rural) | 29.29 | 199.91 | 14.65 |
| Sunderland | 67.96 | 472.77 | 14.38 |
| Liverpool | 66.31 | 519.33 | 12.77 |
| All Rural | 66.44 | 537.44 | 12.36 |
| Newcastle | 66.02 | 542.50 | 12.17 |
| Norfolk (Rural) | 72.84 | 628.03 | 11.60 |
| Sheffield | 63.34 | 551.84 | 11.48 |
| Leicester | 65.16 | 596.93 | 10.92 |
| Nottingham | 65.96 | 605.55 | 10.89 |
| Devon (Rural) | 68.01 | 646.18 | 10.52 |
| Manchester | 68.09 | 649.12 | 10.49 |
| Leeds | 64.78 | 640.99 | 10.11 |
| Birmingham | 68.59 | 697.12 | 9.84 |
| Cardiff | 62.84 | 729.24 | 8.62 |
| Portsmouth | 66.87 | 808.63 | 8.27 |
| Southampton | 60.47 | 819.29 | 7.38 |
| Bristol | 68.40 | 979.36 | 6.98 |
| Oxford | 63.07 | 1254.13 | 5.03 |
| London | 65.70 | 1590.68 | 4.13 |
| Central London | 66.14 | 1691.34 | 3.91 |
–
| All Properties in Sample | |||
| City | Average Floor Area (m) | Average Rental Amount (£ per Calendar Month) | Floor Area per £100 |
| Northumberland (Rural) | 78.09 | 484.42 | 16.12 |
| Shropshire & Mid Wales (Rural) | 96.19 | 611.78 | 15.72 |
| Bradford | 75.82 | 483.33 | 15.69 |
| Lincolnshire (Rural) | 89.37 | 576.22 | 15.51 |
| Newcastle | 91.28 | 601.89 | 15.16 |
| Sunderland | 78.54 | 525.35 | 14.95 |
| All Rural | 86.18 | 653.47 | 13.19 |
| Liverpool | 78.34 | 624.71 | 12.54 |
| Norfolk (Rural) | 91.94 | 748.42 | 12.28 |
| Devon (Rural) | 83.34 | 719.22 | 11.59 |
| Leicester | 80.30 | 709.73 | 11.31 |
| Sheffield | 75.06 | 676.35 | 11.10 |
| Leeds | 72.87 | 687.07 | 10.61 |
| Nottingham | 73.19 | 690.71 | 10.60 |
| Birmingham | 71.25 | 695.73 | 10.24 |
| Manchester | 74.23 | 728.32 | 10.19 |
| Cardiff | 73.97 | 796.66 | 9.28 |
| Portsmouth | 75.31 | 941.11 | 8.00 |
| Southampton | 72.97 | 954.08 | 7.65 |
| Bristol | 72.29 | 1020.39 | 7.08 |
| Oxford | 77.32 | 1407.77 | 5.49 |
| London | 68.50 | 1659.81 | 4.13 |
| Central London | 67.51 | 1752.56 | 3.85 |
–
Key Facts from the Data
- Central London foots the list at 3.91m per £100pcm
- Rural Northumberland is top with 15.68m per £100pcm
- That means renters in Northumberland can rent a property four times larger than their counterparts in the capital for the same price
- Rural areas tend to score better than urban areas
- Northern cities tend to score better than southern cities
- Outside of London, Oxford (5.03m2/£100pcm) and Bristol (6.98m2/£100pcm) are the worst places in the UK
- Southampton is surprisingly low-scoring: 7.38m2/£100pcm
- The average London one bed property (excluding studios) is just 51m2
- By contract, in Rural Shropshire & Mid Wales, the average one bed is 77m2
- The average three bed in Newcastle is a whopping 135m2
- The average two bed in Rural Lincolnshire is just £200pcm – compared to a huge £1,691pcm in London
- Renting a property with more bedrooms doesn’t actually give you much better value for money
OpenRent Comment on the Results
The key message from the data is that despite cities like Oxford, Bristol and London being hugely expensive in terms of monthly rents, the properties afforded by those high rents are by no means luxury.
Having enough room in our homes is very important to our wellbeing, but renters in the south of England are paying a huge premium.
Unsurprisingly, this is most acute in London, where one-bed properties cost an astonishing £100pcm per 3.9 square meters; that’s the same area as a double mattress. The same amount spent on rent in Northumberland would give the renter 16 square meters.
The result is that many in London are compromising on location or who they live with, just to make ends meet. Young couples are pressured to move in together sooner to make rent cheaper. Couples who would previously have lived alone are now forced into flat shares.
Young families who can’t afford to buy are in a tough position, since to find the space they need for their growing families, they are forced to move cities. An exodus of young families to the peripheries of our urban areas will have big effects on what life is like in the UK’s cities.
Simply looking for smaller properties isn’t a solution for renters in the South, either; those properties simply don’t exist. The average two-bed in low-scoring Bristol is 68m2 – the same size as high-scoring Sunderland. The results we see are driven by high rents, not small properties.
This is just one of a long list of quality of living metrics where southern England scores badly. Data we recently published shows that London renters are more likely than renters in any other city to share a bathroom.
Start the discussion at community.openrent.co.uk